
Consumer inflation eases to 10.3pc in September from 11.1pc in August, official data shows

ISLAMABAD: Consumer inflation eased to 10.3 per cent in September from 11.1pc a month earlier, mainly due to a sharp slowdown in food inflation, the Pakistan Bureau of Statistics said on Thursday.
The slight deceleration in the inflation rate, measured by the Consumer Price Index, reversed the sharp increase recorded in August, when higher food and energy prices pushed the annual rate to 11.1pc from 9.2pc in July.
The easing was more pronounced in rural areas, where inflation fell to 10.5pc from 12.2pc, while urban inflation edged down to 10.1pc from 10.4pc.
The September reading was also within the Ministry of Finance’s projection of 10pc to 11pc for the month in its Monthly Economic Update and Outlook for September 2026.
However, despite the decline in the annual rate, prices rose 1.3pc month-on-month in September. The annual inflation rate was 5.8pc in September last year.
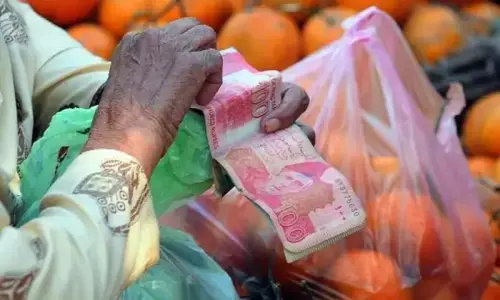
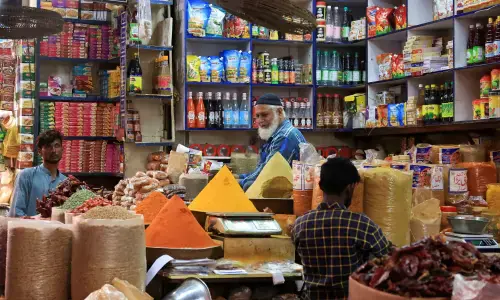
The easing was largely driven by food prices. Food inflation dropped to 8.1pc in urban areas in September from 12.1pc in August. The decline was much sharper in rural areas, where food inflation fell to 7.7pc from 13.2pc a month earlier.
However, non-food inflation moved in the opposite direction, indicating continued pressure on household expenses. Urban non-food inflation accelerated to 11.5pc from 9.4pc in August, while rural non-food inflation increased to 13.1pc from 11.3pc.
The finance ministry had warned in its September 2026 outlook that inflationary pressures were concentrated in food and energy following the impact of higher global oil prices on domestic energy, transport and food costs.
In August, food, housing and utilities, and transport together contributed 8.2 percentage points, or about three-quarters of headline inflation. Food alone contributed 4.9 percentage points.
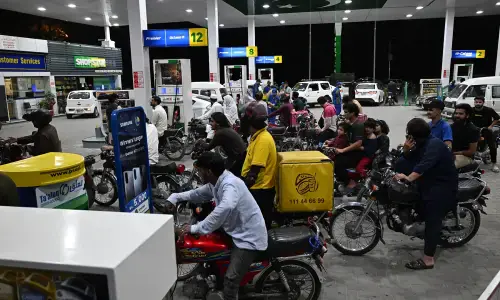
The latest data show that the composition of inflation shifted in September. While food inflation slowed sharply, electricity and transport costs continued to rise. Electricity charges increased by 15.28pc from the previous month, while motor fuel prices rose by 10.76pc in urban areas.
At the national level, transport costs increased by 5.75pc during September and were 27.43pc higher than in the same month last year. Housing, water, electricity, gas and fuels increased by 3.05pc during the month and by 12.39pc on an annual basis.
Core inflation, which excludes volatile food and energy components, also eased slightly. It stood at 8.6pc in urban areas in September, compared with 8.8pc in August, while the rural rate declined to 8.1pc from 8.5pc.
Month-on-month increase and decrease: September 2026 from August 2026
| Food item | Increase | Food item | Decrease |
|---|---|---|---|
| Onions | 39.38pc | Tomatoes | 27.87pc |
| Pulse Gram | 2.42pc | Chicken | 7.57pc |
| Wheat Flour | 1.72pc | Pulse Moong | 3.41pc |
| Gram Whole | 1.10pc | Eggs | 2.92pc |
| Wheat | 1.00pc | Fresh Fruits | 2.56pc |
| Fresh Vegetables | 0.87pc | Potatoes | 2.30pc |
| Mustard Oil | 0.86pc | Milk Powder | 1.98pc |
| Pulse Masoor | 0.85pc | Dessert Preparation | 1.92pc |
| Readymade Food | 0.81pc | Sugar | 1.70pc |
| Wheat Products | 0.70pc | Rice | 0.70pc |
| Vegetable Ghee | 0.60pc | Beans | 0.58pc |
| Tea | 0.57pc | Pulse Mash | 0.43pc |
| — | — | Honey | 0.42pc |
| — | — | Condiments & Spices | 0.24pc |
| — | — | Besan | 0.22pc |
| Non-food item | Increase | Non-food item | Decrease |
|---|---|---|---|
| Electricity Charges | 15.28pc | Transport Services | 0.75pc |
| Motor Fuels | 11.13pc | Textbooks | 0.67pc |
| Liquified Hydrocarbons | 7.58pc | — | — |
| Medical Tests | 1.64pc | — | — |
| Doctor Clinic Fee | 1.41pc | — | — |
| Furniture and Furnishing | 1.11pc | — | — |
| Plastic Products | 0.82pc | — | — |
| Marriage Hall Charges | 0.78pc | — | — |
| Construction Input Items | 0.76pc | — | — |
| Drugs & Medicines | 0.70pc |
Year-on-year increase and decrease: September 2026 from September 2025
| Food item | Increase | Food item | Decrease |
|---|---|---|---|
| Onions | 136.70pc | Potatoes | 34.47pc |
| Wheat | 37.46pc | Sugar | 21.82pc |
| Wheat Flour | 34.31pc | Chicken | 21.31pc |
| Wheat Products | 15.31pc | Eggs | 19.27pc |
| Meat | 10.13pc | Besan | 14.29pc |
| Vegetable Ghee | 9.36pc | Gram Whole | 13.05pc |
| Sweetmeat | 8.81pc | Pulse Gram | 11.99pc |
| Dry Fruits | 8.06pc | Pulse Moong | 10.04pc |
| Milk Fresh | 7.67pc | Pulse Masoor | 10.01pc |
| Mustard Oil | 7.53pc | Gur | 7.95pc |
| Fresh Fruits | 6.99pc | Tomatoes | 7.18pc |
| Fish | 6.88pc | Beans | 3.95pc |
| Milk Products | 6.54pc | Honey | 1.47pc |
| — | — | Condiments & Spices | 1.00pc |
| — | — | Pulse Mash | 0.42pc |
| Non-food item | Increase | Non-food item | Decrease |
|---|---|---|---|
| Liquified Hydrocarbons | 53.98pc | Textbooks | 3.53pc |
| Motor Fuels | 39.70pc | Postal Services | 1.43pc |
| Motor Vehicle Tax | 34.32pc | — | — |
| Electricity Charges | 32.46pc | — | — |
| Construction Input Items | 18.08pc | — | — |
| Personal Effects | 16.88pc | — | — |
| Solid Fuel | 16.45pc | — | — |
| Doctor Clinic Fee | 15.9 |